
Have you ever looked at a business news headline, a survey result, or a chart showing rising prices and wondered what the numbers actually mean?
Perhaps you’ve opened an Excel sheet filled with rows and columns and thought, “I know I need this skill, but where do I even begin?”
You’re not alone.
Today, students don’t need to become programmers, data scientists, or engineers to benefit from understanding data. Whether you’re studying commerce, arts, humanities, psychology, management, or science, the ability to interpret information is becoming an important life and career skill.
Think about the decisions you make every day. Which course should you choose? Is an online claim trustworthy? Which product offers better value? Why are companies changing their prices? What does a survey actually tell us?
Behind many of these questions is data.
Data literacy for non-tech students means learning how to understand, interpret, question, and communicate information using data—even if you have never written a line of code.
And you can start with three practical skills: Excel, charts, and reading the news with an analytical mindset.
In this guide, we’ll explore how these skills work, how students in India can practise them using everyday examples, and how developing data literacy can help you make more informed academic, personal, and career decisions.
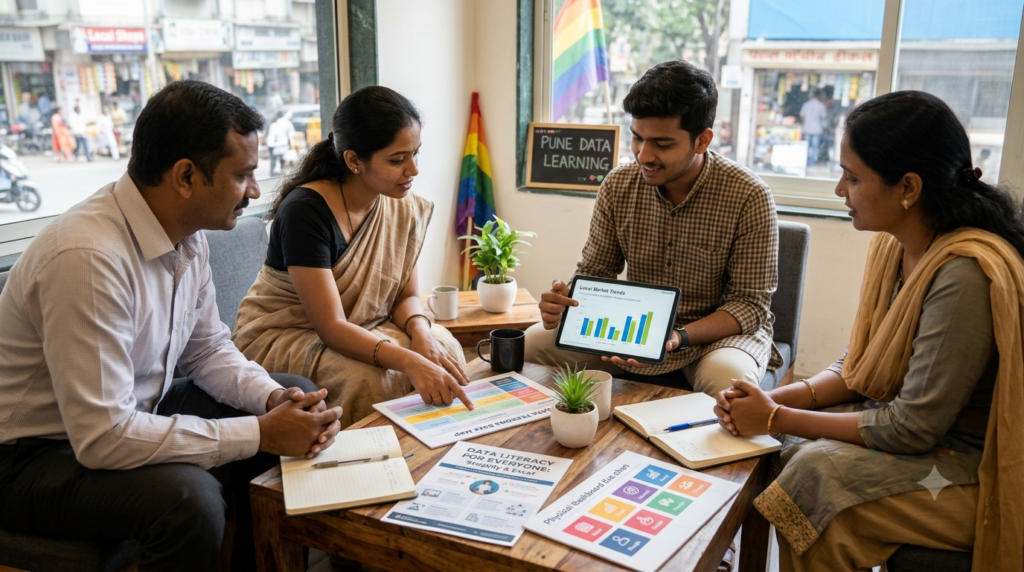
Data literacy is the ability to read, understand, analyse, question, and communicate information presented through numbers, tables, charts, reports, and other forms of data.
Let’s make this practical.
Suppose a college survey reports that 70% of students prefer online learning. A person who simply reads the headline might conclude that most students learn better online.
A data-literate student asks a few more questions:
See the difference?
Data literacy isn’t about memorising numbers. It’s about understanding what the numbers mean—and what they don’t mean.
This skill is relevant to students across disciplines. A commerce student might compare business expenses, a psychology student might interpret survey responses, a humanities student might examine population trends, and a management student might evaluate customer feedback.
In India, data literacy is also receiving greater attention in education. For the 2026–27 academic year, the government has announced the introduction of a Computational Thinking and Artificial Intelligence curriculum for Classes III to VIII, with data literacy among its areas of focus. Press Information Bureau
The direction is clear: students can benefit from learning how to think critically about information, not just how to use digital tools.
You might be thinking, “I’m studying commerce, psychology, arts, or management. Why do I need data skills?”
Because data is already part of your world.
Commerce and business students
Understand sales figures, expenses, budgets, customer trends, profit margins, and business performance instead of relying entirely on someone else’s interpretation.
Psychology and humanities students

Organise survey responses, interpret research findings, compare social trends, and distinguish evidence from assumptions.
Marketing and management students
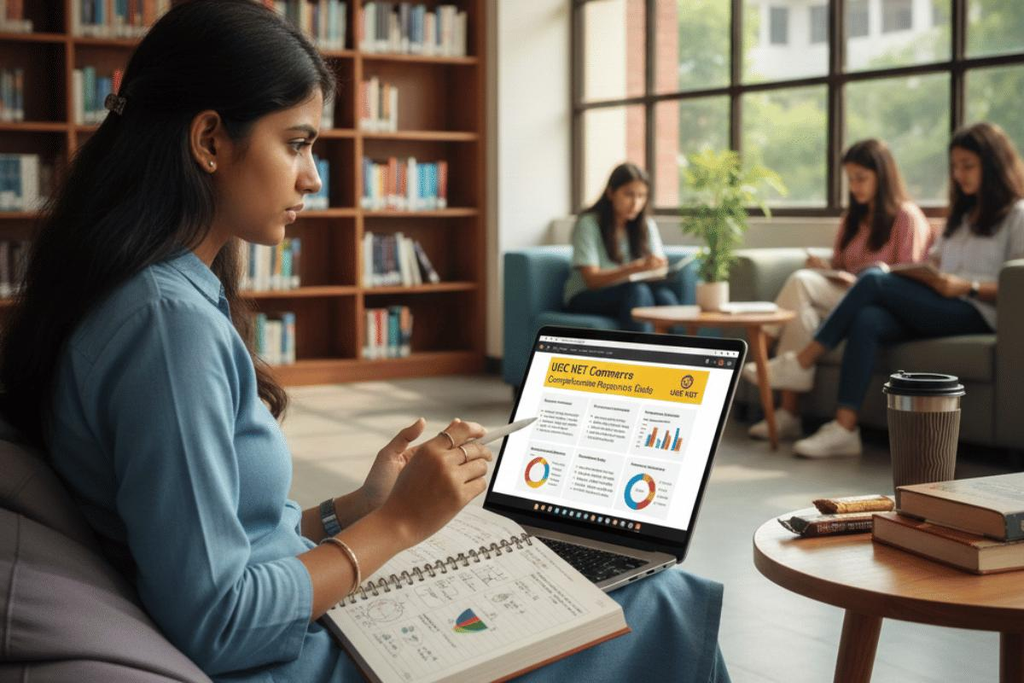
Compare campaign performance, understand customer behaviour, interpret engagement metrics, and evaluate which strategies are working.
Arts, media, and general studies students
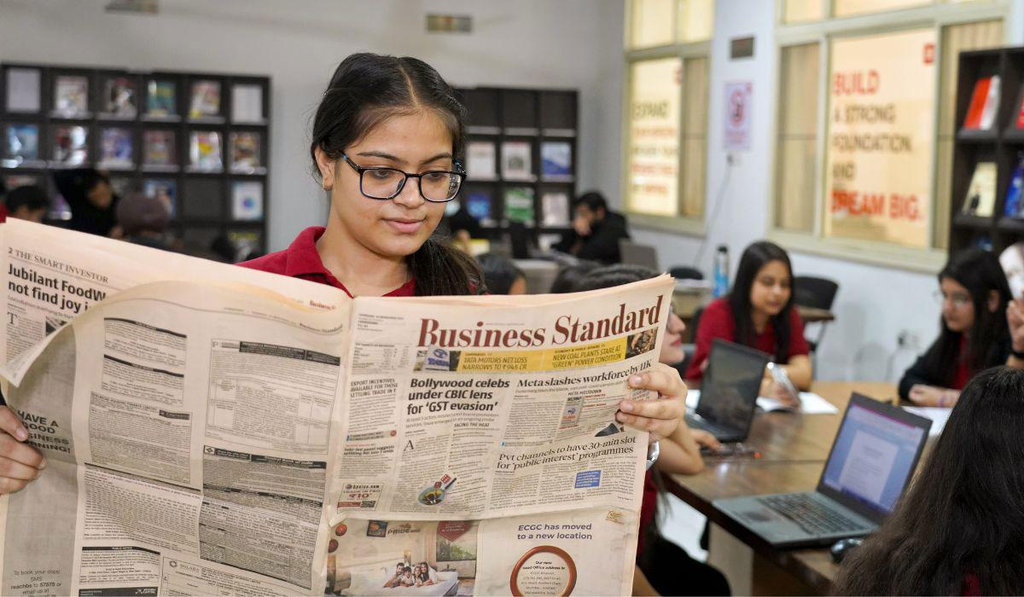
Evaluate news claims, understand public opinion polls, interpret economic statistics, and communicate information accurately.
You don’t need to master advanced mathematics or learn a programming language to begin. You need curiosity, a willingness to check your assumptions, and some practical tools.
Microsoft’s beginner learning resources, for example, introduce data concepts such as sorting, filtering, grouping, and visualising information in Excel without requiring students to start with advanced analytics. Microsoft Learn+1
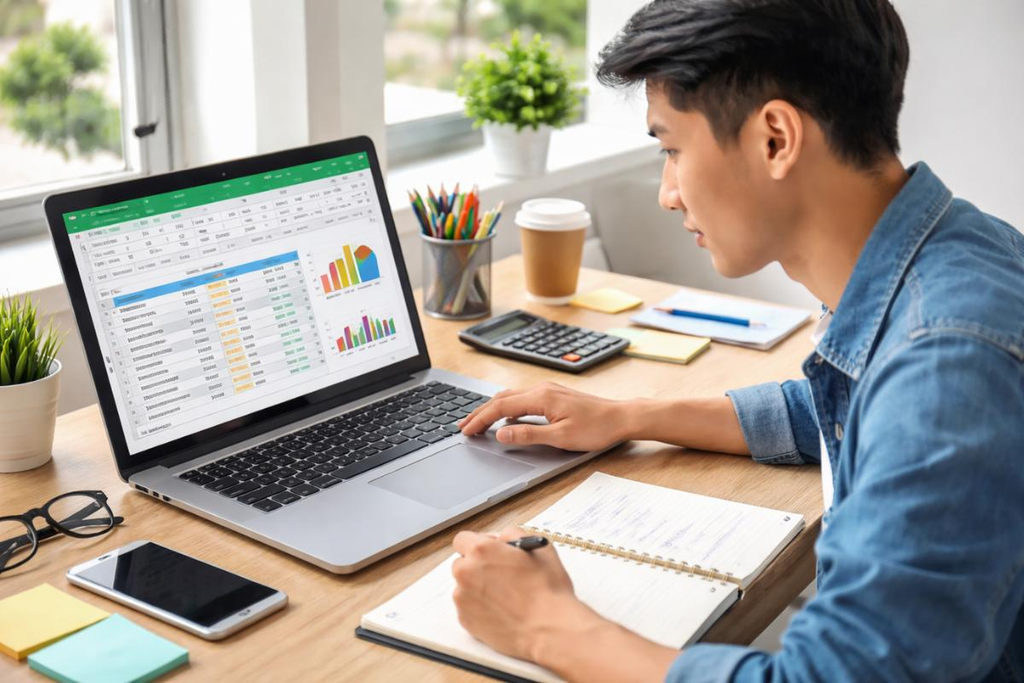
Excel is one of the most useful starting points for data literacy for non-tech students.
You may already have seen Excel used for attendance sheets, college marks, household budgets, office reports, or business accounts. But Excel is much more than a place to enter numbers.
It helps you organise information, perform calculations, spot patterns, and present findings clearly.
You don’t need to learn every formula or feature. Start with the basics that solve everyday problems.
Imagine you want to track your monthly expenses.
You might create a table with columns for the date, category, description, and amount.
| Date | Category | Description | Amount |
|---|---|---|---|
| 2 Oct | Food | Lunch | ₹180 |
| 3 Oct | Travel | Bus fare | ₹60 |
| 4 Oct | Education | Study material | ₹450 |
| 5 Oct | Food | Groceries | ₹520 |
Each row records one expense, and each column records a particular type of information.
This structure makes it easier to find information and calculate totals.
Start with these beginner-friendly formulas:
| Formula | What it does | Example |
|---|---|---|
=SUM(D2:D5) | Adds amounts | Total expenses |
=AVERAGE(D2:D5) | Calculates the average | Average expense |
=MAX(D2:D5) | Finds the largest value | Highest expense |
=MIN(D2:D5) | Finds the smallest value | Lowest expense |
=COUNT(D2:D5) | Counts numerical entries | Number of recorded expenses |
You don’t have to memorise dozens of formulas on day one. Learn a formula, use it in a small project, and repeat until it becomes familiar.
Suppose your expense sheet contains 100 entries.
Instead of reading every row, you can sort the amounts from largest to smallest or filter the category column to display only food expenses.
The same skills can help you:
The fastest way to become comfortable with Excel is to use it for something that matters to you.
Try one of these mini-projects:
The objective isn’t to create a complicated spreadsheet. It’s to start with a question, organise the information, calculate a few results, and explain what you discovered.
For guided practice, explore Microsoft Excel tutorials through Microsoft Excel Support or the Microsoft Learn data concepts pathway. Microsoft Support+1
Have you ever seen a graph in a newspaper, on Instagram, or in a business presentation and accepted its conclusion without checking the numbers?
You’re not alone. Charts are designed to make information easier to understand, but a poorly designed chart can also create the wrong impression.
Learning to read charts is an essential part of data literacy for non-tech students because it helps you turn numbers into meaningful insights.
1. Bar or column chart
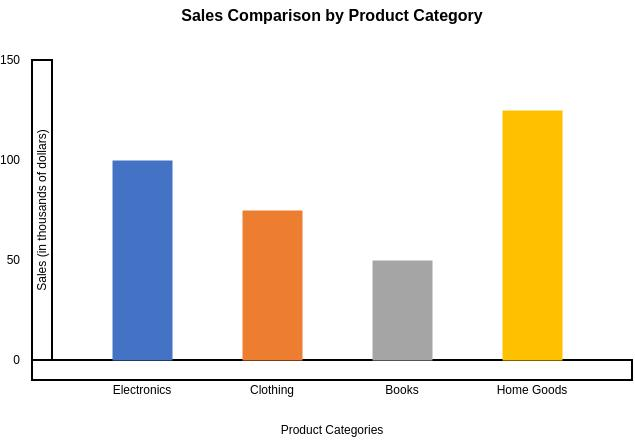
Use it to compare different categories.
Example: Compare marks in English, Mathematics, Science, and History. You can quickly see which subject has the highest or lowest score.
2. Line chart
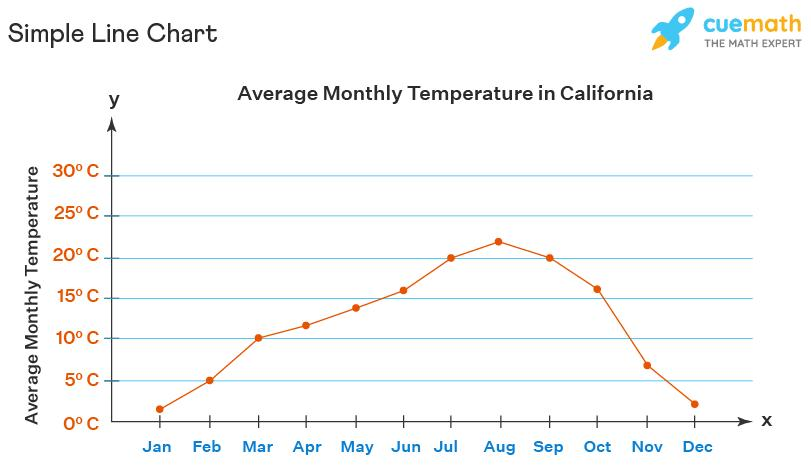
Use it to show changes over time.
Example: Track your study hours over eight weeks or compare monthly electricity bills to see whether your spending is increasing.
3. Pie chart
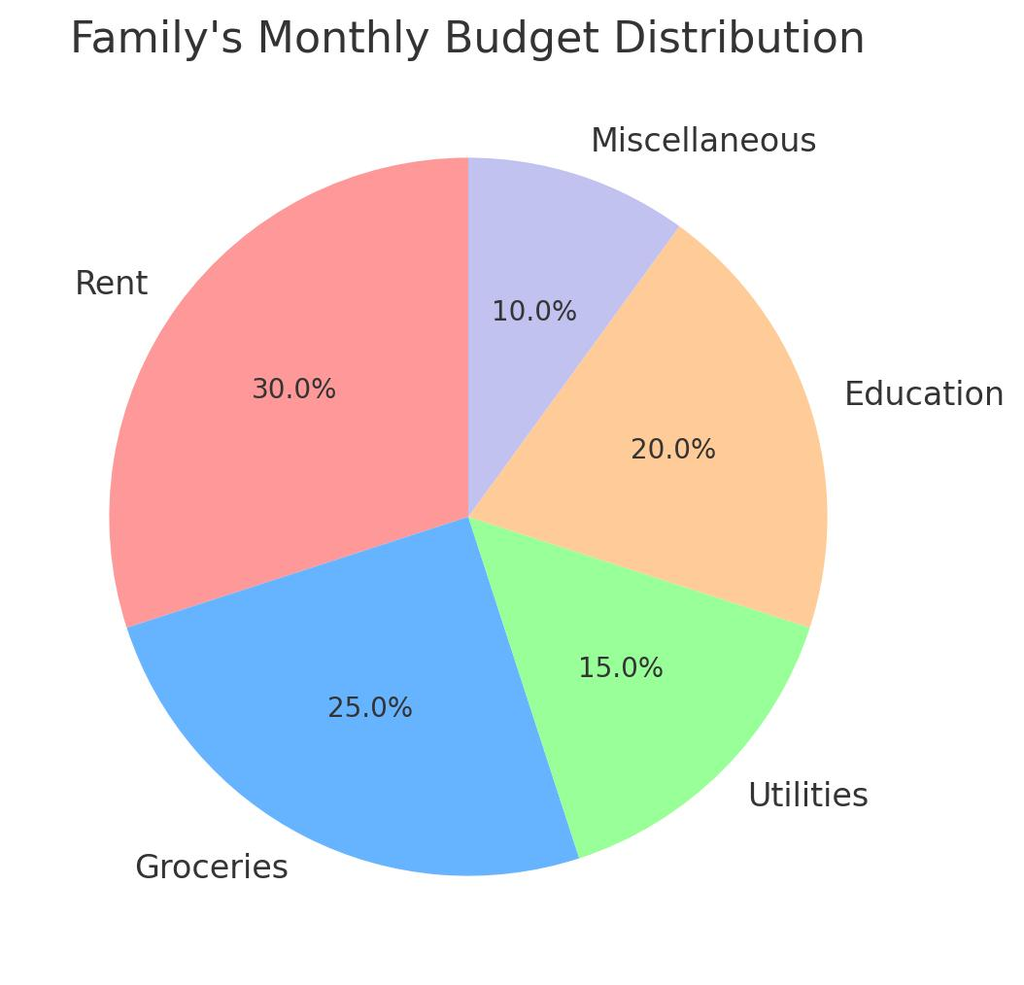
Use it to show how categories contribute to a whole.
Example: Understand how a monthly budget is divided between rent, food, transport, and savings. It works best when there are a few clear categories.
4. Scatter plot
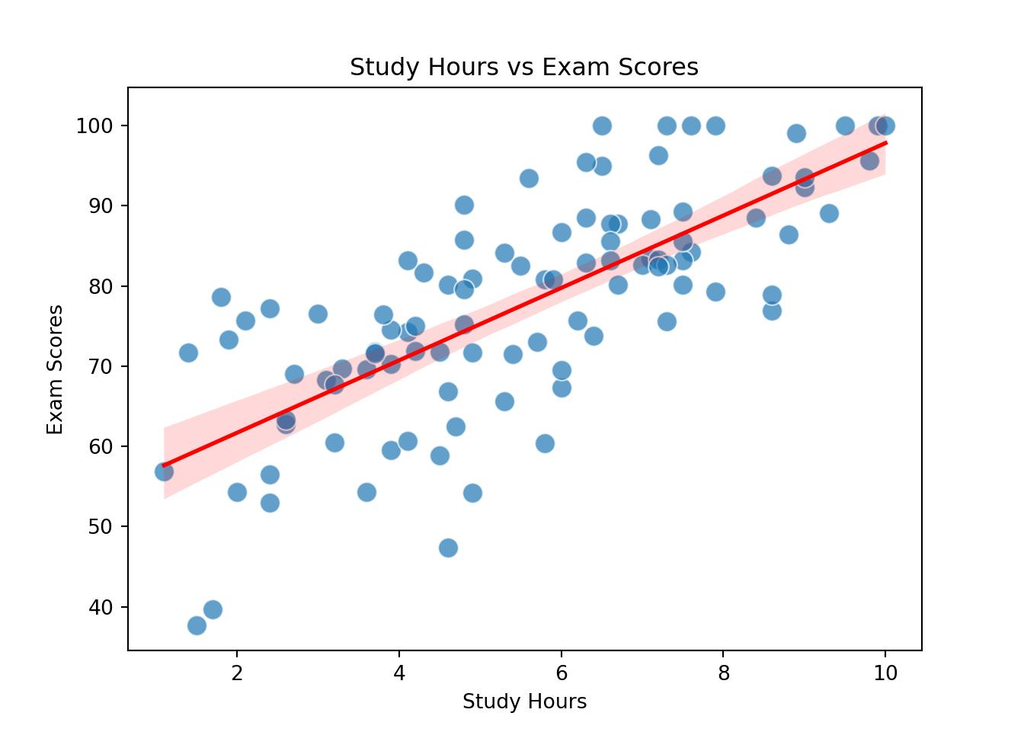
Use it to explore the relationship between two numerical variables.
Example: Compare students’ study hours with their exam marks to see whether the two tend to move together. A relationship alone doesn’t prove that one causes the other.
Whenever you see a chart, don’t jump straight to the conclusion. Ask these questions:
These questions are simple, but they can prevent you from misunderstanding information.
Imagine a college is comparing average marks before and after introducing a new study programme.
Average student marks before and after a study programme
Illustrative data only; this comparison does not prove the programme caused the change.
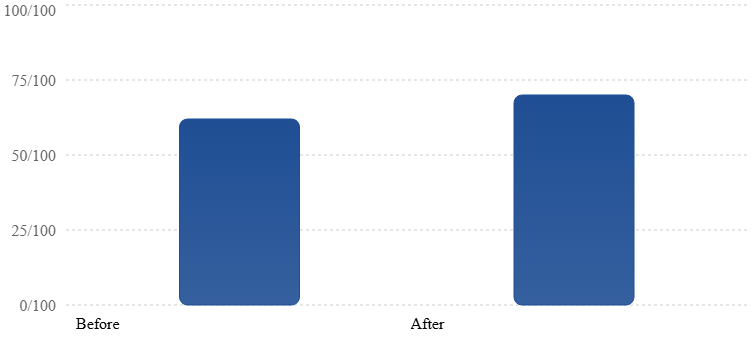
What can you reasonably conclude?
That final point is important. Data literacy means knowing when the evidence supports a conclusion—and when you need more information.
This is where data literacy becomes especially valuable outside the classroom.
Every day, we see claims about inflation, unemployment, exam results, college placements, salary packages, business growth, and artificial intelligence.
Some claims are accurate. Others leave out important details. Some use genuine numbers to create a misleading impression.
A data-literate student learns to read beyond the headline.
At first glance, this sounds convincing.
But before accepting the claim, ask:
A survey of 100 students at one college may tell you something about those students. It cannot automatically represent every student in India.
This may be true for a particular group, occupation, or period. But the headline doesn’t tell you the whole story.
Check whether the figures refer to average or median earnings, which graduates were included, how long after graduation the data was collected, and whether the comparison accounts for experience, occupation, and location.
A statistic can be correct while still giving an incomplete picture.
Does this mean studying for six hours causes higher marks?
Not necessarily.
Students who study longer might also have better resources, stronger foundations, more support, or different exam preparation strategies. Some students may need fewer hours because they use their study time more effectively.
To understand the relationship, you need more than two numbers. You need context.
One useful approach to evaluating online information is the SIFT method, developed by digital literacy educator Mike Caulfield. It encourages readers to stop, investigate the source, find better coverage, and trace claims back to their original context.
Here’s how to apply it:
This is especially useful when an impressive statistic appears in a viral social media post.
In 2026, AI tools can summarise reports, explain charts, and help students work with spreadsheets. But a confident answer isn’t automatically a correct one.
If an AI tool tells you that a particular career has the highest salary or that a survey proves a certain conclusion, verify the underlying information.
Check the source, date, population, definitions, and calculations. When possible, open the original report rather than relying entirely on a summary.
Use AI to help you ask better questions—not as a replacement for independent judgement.
If you remember just one practical framework from this article, make it this one.
1. Ask
What question am I trying to answer? For example, are my study hours increasing each week?
2. Check
Is the information complete, accurate, relevant, and from a trustworthy source?
3. Analyse
Calculate totals, compare categories, identify trends, and look for unusual results.
4. Explain
Summarise what the information tells you, what it doesn’t tell you, and what you would investigate next.
You can use this framework for a college assignment, a business presentation, a news article, or a personal budget.
The subject changes. The thinking process stays the same.
You don’t need to spend months studying before you can start applying data literacy. Give yourself 15–20 minutes a day and work through these four weeks.
Days 1–7
SUM, AVERAGE, MIN, and MAX.Days 8–14
Days 15–21
Days 22–30
By the end of the month, you should have more than theoretical knowledge. You should have a small project that demonstrates how you approach a question, handle information, and communicate a finding.
That is a practical way to begin building a skill you can continue developing throughout college and beyond.
Learning Excel and charts is useful, but the real value comes from avoiding mistakes when interpreting information.
A percentage without its sample size or context can be misleading. Always ask where the number came from and what it represents.
A pie chart with 20 categories is difficult to interpret. A line chart is usually better for showing change over time, while a bar chart is often more suitable for comparing categories.
Two things can happen together without one causing the other. If students who study longer tend to score higher, that doesn’t automatically prove study time alone explains the difference.
Incorrect entries, missing values, inconsistent categories, and duplicate records can lead to incorrect conclusions. Check your data before analysing it.
AI can help you create formulas, explain statistical concepts, and generate charts. However, you should still verify calculations, check sources, and understand the conclusions you’re presenting.
The goal isn’t to avoid technology. It’s to use technology intelligently.
Data literacy is not a guarantee of employment, and it doesn’t replace the qualifications required for a particular profession. However, it can complement your existing knowledge and make your work more effective.
| Career area | How data literacy can help |
|---|---|
| Marketing | Compare campaign results and customer engagement |
| Human resources | Interpret employee surveys and recruitment data |
| Psychology | Understand research findings and survey results |
| Commerce and finance | Organise budgets and analyse financial information |
| Journalism | Verify statistics and explain public-interest data |
| Management | Track performance and communicate business trends |
| Education | Review student progress and interpret assessment results |
For example, a marketing student who can explain why one campaign performed better than another brings something valuable to a team. A psychology student who can organise survey responses and explain the limitations of their findings can strengthen their research skills.
The advantage comes from combining subject knowledge, analytical thinking, communication, and practical tool skills.
You don’t need to become a data analyst to benefit from thinking like one.
You can begin learning without purchasing an expensive course.
Microsoft Excel (Explore Excel tutorials)
Practise spreadsheet basics, formulas, sorting, filtering, and charts.
Google Sheets
A browser-based spreadsheet option for organising data, performing calculations, and collaborating on projects.
SWAYAM
Explore the course Understanding Data – Practical Foundations for Non-Tech Students, which introduces data collection, preparation, visualisation, and responsible use of data.
Microsoft Learn
Follow beginner-friendly modules on data concepts, sorting, filtering, grouping, and visualisation.
Check course availability and enrolment requirements on the respective websites before starting.
Data literacy is the ability to understand, interpret, question, and communicate information using data. It helps you make informed decisions rather than accepting every number or claim at face value.
Yes. You can develop foundational data literacy without learning programming. Start with Excel or Google Sheets, basic calculations, charts, and critical evaluation of information. Coding can be useful for more advanced work, but it is not a prerequisite for these fundamentals.
Excel is an excellent starting point, but data literacy involves more than operating a spreadsheet. You also need to assess data quality, interpret results, recognise limitations, and communicate findings accurately.
Start with entering and formatting data, basic formulas such as SUM and AVERAGE, sorting, filtering, and creating bar and line charts. Once you are comfortable, move on to conditional formatting, lookup functions, and PivotTables.
These students regularly encounter statistics in research, business reports, surveys, economic news, social studies, and marketing. Data literacy helps them interpret evidence, evaluate claims, and communicate their conclusions more clearly.
You can learn basic spreadsheet operations and chart interpretation in a few weeks with regular practice. Developing stronger analytical judgement takes longer and improves as you work with different types of data and real-world questions.
Data literacy can complement your degree and other professional skills. Its value depends on the role, your level of proficiency, and how effectively you apply it. Some careers require more advanced analytical or technical expertise than others.
You don’t have to study computer science to understand data.
You don’t have to become a mathematician to interpret a chart.
And you certainly don’t have to master every digital tool before you start asking better questions.
Begin with a simple spreadsheet. Learn to recognise patterns. Question the statistics you encounter in the news. Check the source before sharing a claim. Explain your findings in language another person can understand.
Over time, these small habits can help you become a more independent learner and a more thoughtful decision-maker.
The real power of data literacy isn’t knowing how to use Excel. It’s knowing how to think clearly when someone presents you with numbers.
And that is a skill worth developing, whatever you choose to study or do for a living.

Learning practical skills such as data literacy is one way to prepare for the future. Another important step is understanding your own interests, abilities, learning needs, and career preferences.
At SH Development Academy, Santosh Hariharan — DMIT Consultant, Parent & Career Coach, and Success Mindset Coach for Students — helps students and parents explore educational choices and career pathways through personalised guidance.
If you’re unsure which skills to develop, which career options to explore, or how to make better-informed decisions about your future, a career guidance consultation can help you reflect on your options and create a practical next-step plan.
Our online Psychometric Aptitude Test and Career Guidance Consultation can be an option for exploring aptitude, interests, and possible career directions. Assessment results should be considered alongside your academic experience, preferences, and other relevant information—not as a guarantee of career success.
Explore our services or get in touch to discuss your needs.
Get personalised guidance to explore your strengths, interests, and future possibilities.Explore SH Development Academy
Call or WhatsApp
+91 8421315400
+91 7303290862
⭐ Trusted by parents and families
Success & Happiness are the two most important yet elusive things which every human being yearns to achieve in life. Real success and happiness can be savoured only when one enjoys good health and good family relations, along with a good professional career and sound financial stability.
Our Visitor


 Users Today : 7